01Real estate is one of Dubai’s most visible outdoor advertising categories
Dubai remains the main hub for property developers’ advertising in the UAE. From 16 January to 5 August 2026, monitoring recorded 85 real estate brands across 727 unique screens in the city. The dataset includes 5,399 ad appearances and 234.4 million OTS — opportunities to see the ads.
That scale creates opportunities, but it also means more competition. Running ads steadily on a handful of screens can leave a project barely visible alongside dozens of developers and developments. So don’t start with how many ad appearances to buy. Start by looking at when the category gets busy, where competitors advertise and how much potential exposure your chosen screens offer.
| Metric | Total |
|---|---|
| Total OTS | 234,391,898 |
| Ad appearances | 5,399 |
| Unique brands | 85 |
| Unique screens | 727 |
Study scope: the REAL ESTATE category in Dubai, observed from 16 January to 5 August 2026. The analysis covers OTS, ad appearances, brands, screens and monthly trends.
02Three clear peaks: February, April and July
Activity was uneven across the period. April had the highest OTS at 73.7 million, followed by February at 50.7 million. July brought another clear surge, reaching 38.5 million. Together, these three months accounted for about 69.5% of the total OTS in the dataset.
| Month | OTS |
|---|---|
| January* | 11,046,369 |
| February | 50,659,031 |
| March | 31,731,678 |
| April | 73,729,924 |
| May | 10,970,200 |
| June | 5,947,711 |
| July | 38,492,064 |
| August* | 11,814,921 |
* January includes data from 16 January onwards; August only covers 1–5 August. These figures should not be compared directly with full months.
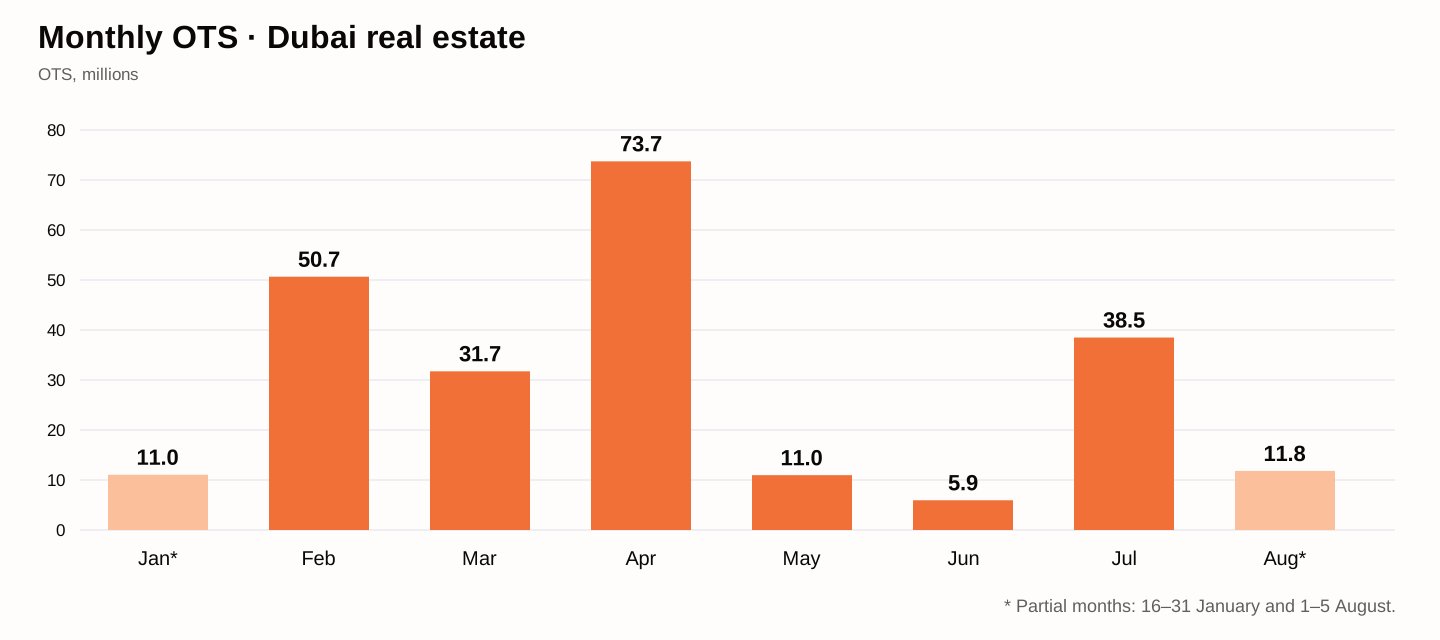
Figure 1. Monthly OTS for the REAL ESTATE category in Dubai. Source: METER monitoring data.
June had the lowest OTS of any full month, at 5.9 million. By July, the figure had risen more than sixfold. This points to a market that moves in waves: developers step up outdoor advertising around launches and key sales periods rather than keeping the same level of activity all year.
What this means for your campaign timing
A high category OTS doesn’t automatically make a month the best choice for every campaign. April, February and July were, above all, periods of strong competitor activity. They may offer access to busy locations and a large number of potential contacts, but they also make it easier for a project to get lost in the crowd.
For a major launch, a busy period can work — provided you secure a visible mix of screens and enough advertising activity ahead of time.
To stand out more within the category, consider a quieter period and screens where competition is lighter.
For a longer campaign, split the budget into several waves and review the plan after each one.
03Leading brands peak at different times
Developers don’t all follow the same calendar. OHANA DEVELOPMENT peaked in February, EMAAR and IMTIAZ DEVELOPMENTS in April, and ARADA and CITI DEVELOPERS in July. Your media plan should reflect the timing of your own project, not just the property market’s overall seasonal pattern.
| Brand | OTS | Ad appearances | Peak month |
|---|---|---|---|
| ARADA | 28.9m | 334 | July |
| OHANA DEVELOPMENT | 19.3m | 129 | February |
| CITI DEVELOPERS | 17.5m | 824 | July |
| EMAAR | 15.7m | 1,217 | April |
| IMTIAZ DEVELOPMENTS | 11.4m | 65 | April |
04Ad appearances and OTS tell different stories
The brands with the most ad appearances aren’t necessarily the ones with the highest OTS. The difference is especially clear in the peak months.
February 2026
| Brand | Ad appearances | OTS |
|---|---|---|
| TARRAD DEVELOPMENT | 91 | 2.47m |
| ARY&MAZ | 67 | 0.90m |
| RABDAN DEVELOPMENTS | 66 | 2.74m |
| ARADA | 50 | 6.75m |
| FAKHRUDDIN | 43 | 3.51m |
TARRAD DEVELOPMENT led on ad appearances, but ARADA recorded much higher OTS with 50 appearances versus 91. This points to differences in the potential exposure offered by the screens each brand used.
April 2026
| Brand | Ad appearances | OTS |
|---|---|---|
| EMAAR | 1,192 | 14.94m |
| WASL | 650 | 4.91m |
| CITI DEVELOPERS | 141 | 2.26m |
| TARRAD DEVELOPMENT | 136 | 5.77m |
| ARY&MAZ | 100 | 1.53m |
In April, activity was heavily concentrated around EMAAR: 1,192 ad appearances were associated with 14.94 million OTS. Even within that month, though, the relationship between appearances and OTS varied substantially from brand to brand.
July 2026
| Brand | Ad appearances | OTS |
|---|---|---|
| CITI DEVELOPERS | 371 | 8.50m |
| ARADA | 137 | 10.29m |
| ARY&MAZ | 31 | 0.17m |
| SHAMAL HOLDING | 30 | 1.34m |
| ELLINGTON PROPERTIES | 27 | 1.86m |
In July, CITI DEVELOPERS recorded 371 ad appearances and 8.50 million OTS. ARADA reached 10.29 million OTS with 137 appearances. In this comparison, almost three times as many appearances did not translate into higher total OTS.
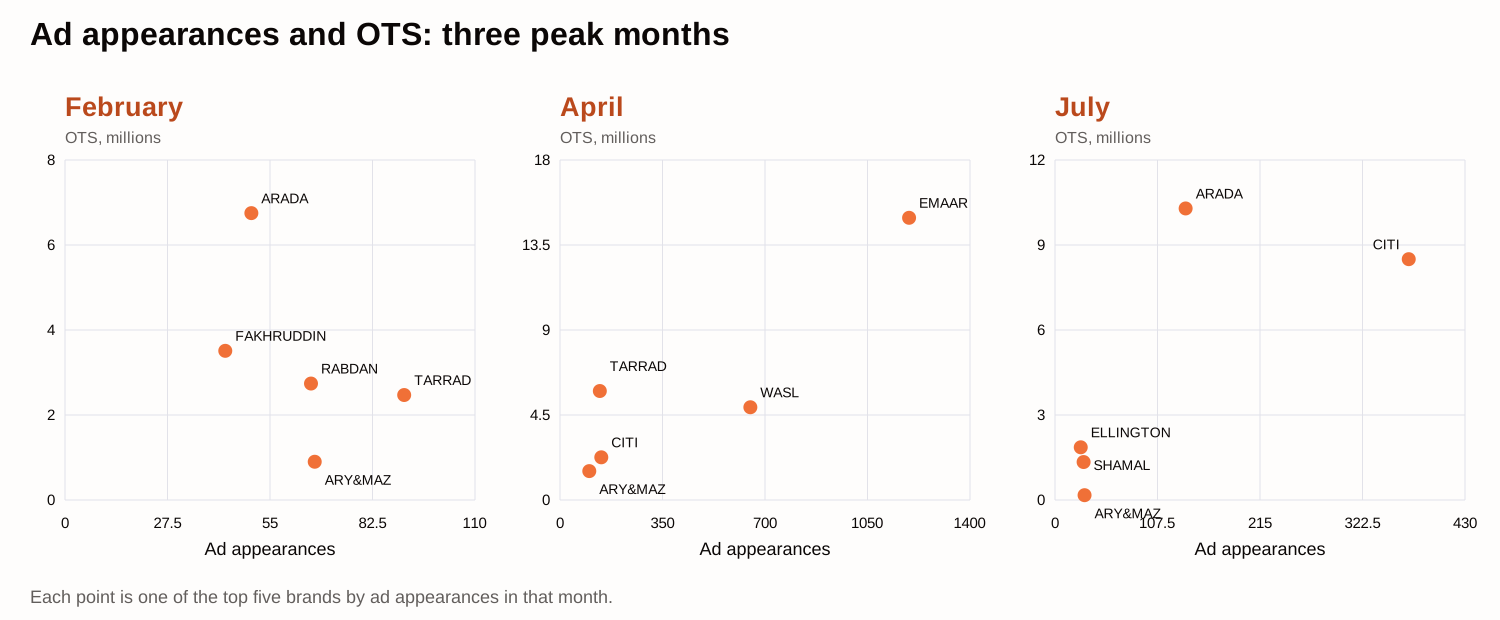
Figure 2. Ad appearances and OTS for the top five brands by appearances in February, April and July. Source: METER monitoring data.
05Five ways to build a better DOOH plan in Dubai
Check the competition first. Before booking, find out which brands are active, when they step up their advertising and which screens they use.
Give each campaign wave a clear job. One might build awareness; another might support sales or launch the next phase of a development.
Look at screen choice and frequency together. If ad appearances increase but OTS doesn’t, you may need a different mix of screens rather than more repeats.
Plan each project separately. Developments have different launch dates, locations, audiences and competitors.
Review results between waves. Compare recorded ad appearances and OTS after each wave, then adjust the next placement.
06Turn market insights into a campaign with GEOMOTIVE
Monitoring data helps you understand the market before you launch: how active the category is, when competition peaks and how brands approach their campaigns. The next step is turning those observations into a practical media plan.
With GEOMOTIVE, advertisers can plan and launch digital out-of-home (DOOH) campaigns, choosing locations, dates and campaign settings. For real estate, this means planning around a specific development and business goal: going live before a competitor peak, building visibility during a key period or moving budget to screens with stronger potential.
The process is straightforward: monitor the market → choose your timing and screens → launch the campaign → check actual activity → adjust the next wave.
Methodology and data limitations
Scope: the REAL ESTATE category in Dubai, observed from 16 January to 5 August 2026. OTS represents potential contacts with the monitored advertising activity; it is not unique reach. The data does not show budgets, placement costs, unique audiences or how often each person actually saw an ad. January and August are partial periods, with August covering only 1–5 August.
Source: METER monitoring data. Data powered by METER.